
Audit trail
The audit trail is an append-only, hash-linked log of every significant event in Flezise. Use it to answer who did what, when, and in what order across every project in the organization. The trail is tamper-evident: each entry's SHA-256 hash covers its project ID, sequence number, timestamp, event type, payload, and the previous entry's hash, so altering any record invalidates every entry that follows it.
What is recorded
Each entry carries an event type, a category, the actor (person or agent), a sequence number, a timestamp, and a hash linking it to the previous entry. Events group into four categories:
When the builder agent acts for a signed-in user, such as approving an artifact or creating a work item, the entry appears under that user's name. The agent runs as the signed-in user and with that user's permissions.
Views
The audit trail is accessible in three scopes, each narrowing the events shown.
Settings → Audit Trail shows org-wide activity across every project. The columns are Time, Category, Event, and Actor. This view spans multiple project chains and is not chain-verified; no chain badge appears here. It is the broadest view and is read-only.
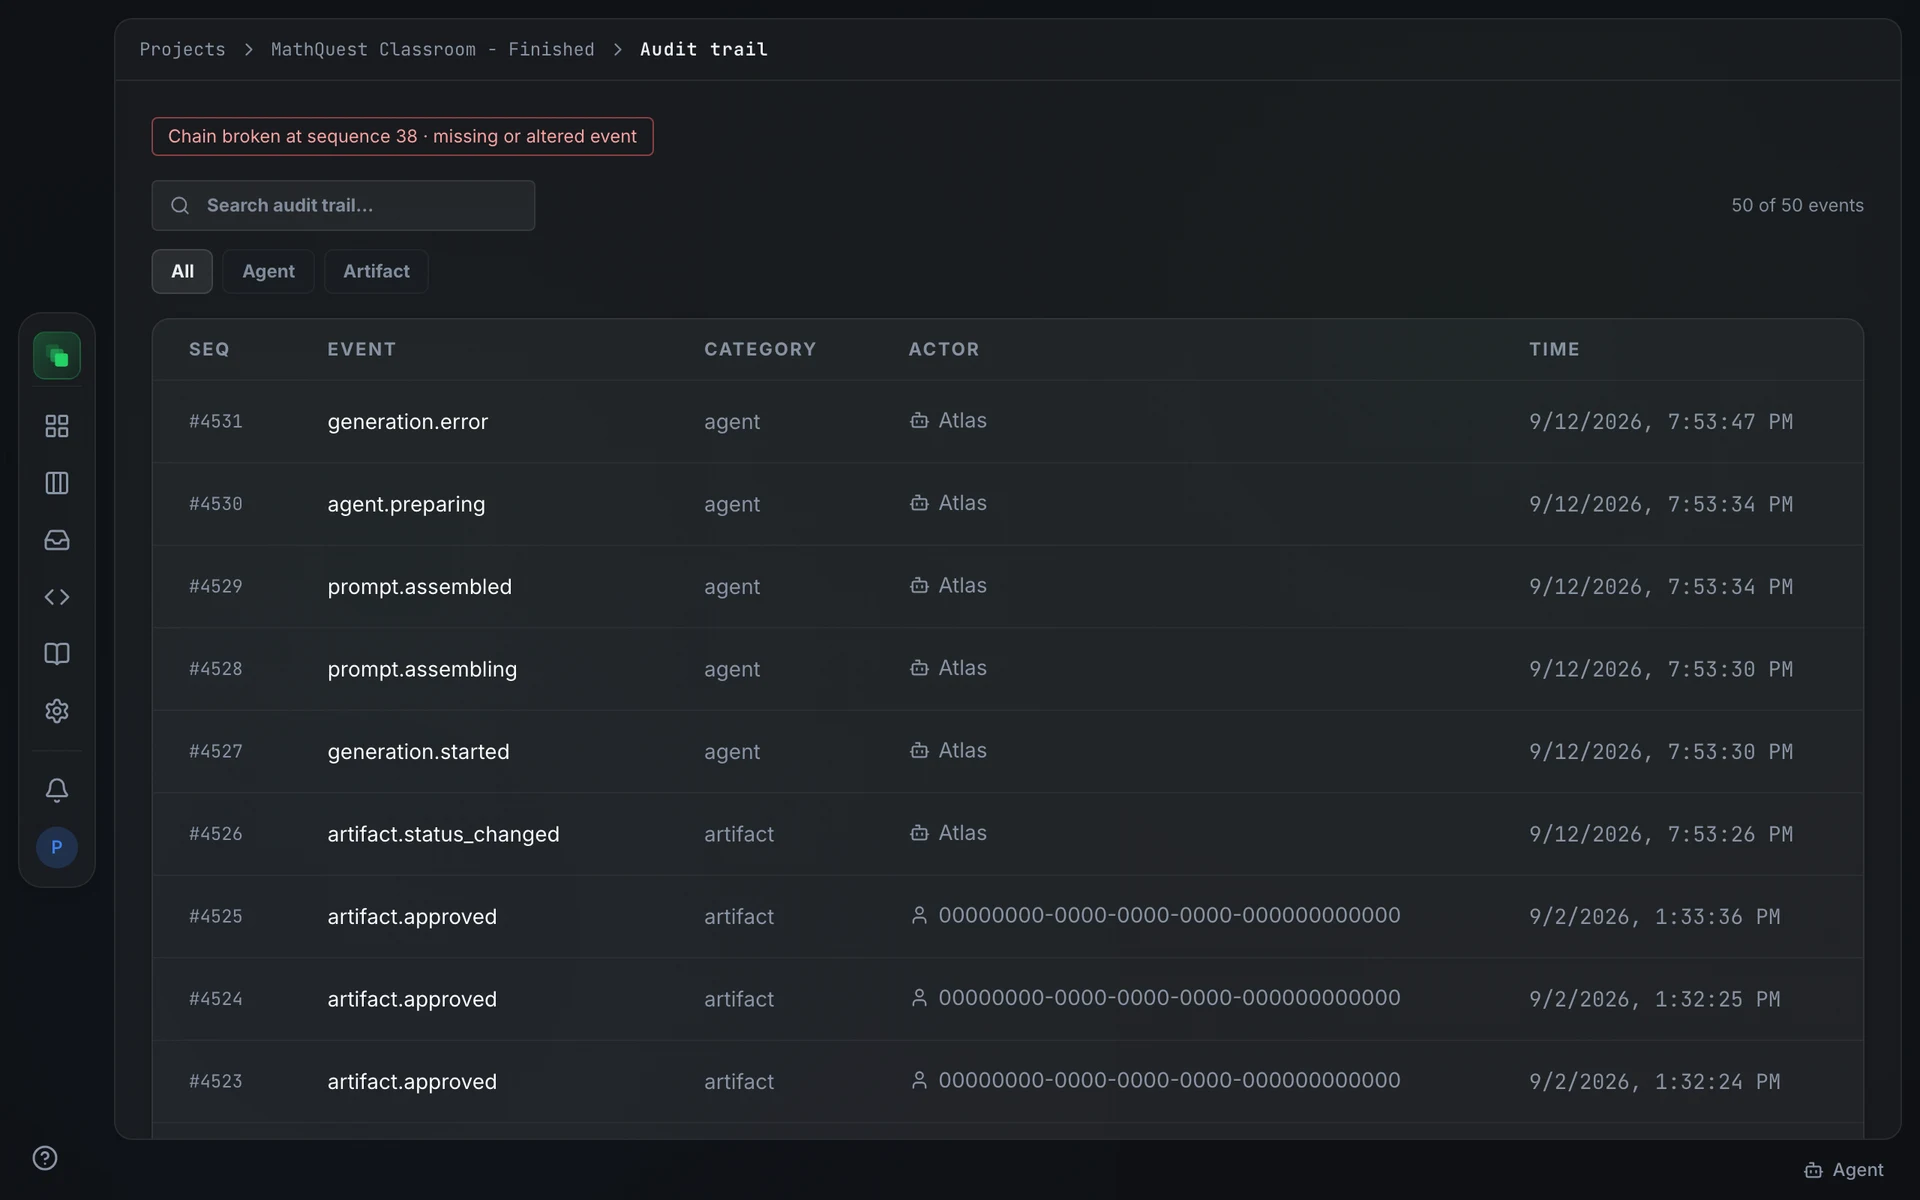
The per-project trail, accessible at /projects/<project>/audit or from project Settings → Audit Trail, scopes events to one project. It adds a Seq column with each entry's chain sequence number and a chain badge above the table. The column order is Seq, Event, Category, Actor, Time.
The per-artifact event timeline, accessible within an artifact, scopes events to a single artifact. Internal pipeline events (agent.preparing, agent.response_received) are excluded from this view; they remain visible at the project and org level.
Chain integrity
The per-project audit trail displays a chain badge above the table.
A broken chain means an event was altered or removed after it was written. If the badge turns red, contact your platform administrator.
A red chain badge indicates a potential integrity failure. Do not rely on that project's audit trail for compliance purposes until the issue is investigated.
Search and filter
Type in Search audit trail... to filter visible entries without a server round trip. The search covers event type, category, actor name, sequence number, and timestamp. The category pills narrow the list to a single group; the pills are derived from the categories present on the current page. An entry count updates as you type or switch pills.
Reading an event
Click any row to expand it. The expanded panel shows:
- A hash excerpt:
hash <first 24 chars>… ← prev <first 24 chars>…, or(genesis)for the first entry in a project's chain - The event's JSON payload containing the context recorded at the time of the event
Click the row again to collapse it.
Pagination
The trail loads 50 entries per page, newest first. The footer shows the current range and total (Showing 1–50 of 243 recorded events) with Previous and Next buttons to move through the log. When a filter or search term is active, the footer shows how many entries on the current page match.
FAQ
Do actions the builder agent takes appear under the agent's name or mine?
They appear under your name. The builder agent always acts as the signed-in user, with your permissions. Every write it makes (approving, creating, submitting) is attributed to you in the audit trail, the same as if you had clicked the button yourself.
What does the bot icon next to an actor mean?
The bot icon marks an automated actor: the verifier agent recording review findings, or a background process that dead-letters a failed run. A person icon appears for named users.
Next steps
- Run history: the org-wide generation run list, where each row corresponds to a
generation.*audit event - Review and approve artifacts: every approval writes an
artifact.approvedentry to the trail - Runs: the project-level run view with dispatch timeline and evidence