
Request tracing
Request Tracing is the gateway request-log explorer. It shows stats, a volume histogram, and a searchable table of every request the AI Gateway has handled. Drill into any row to read the raw message payloads and tool-call details.
::::note
Read this if you administer the platform AI Gateway. Logs are written by the gateway's log_store component; if the table is empty, verify that component is running.
::::
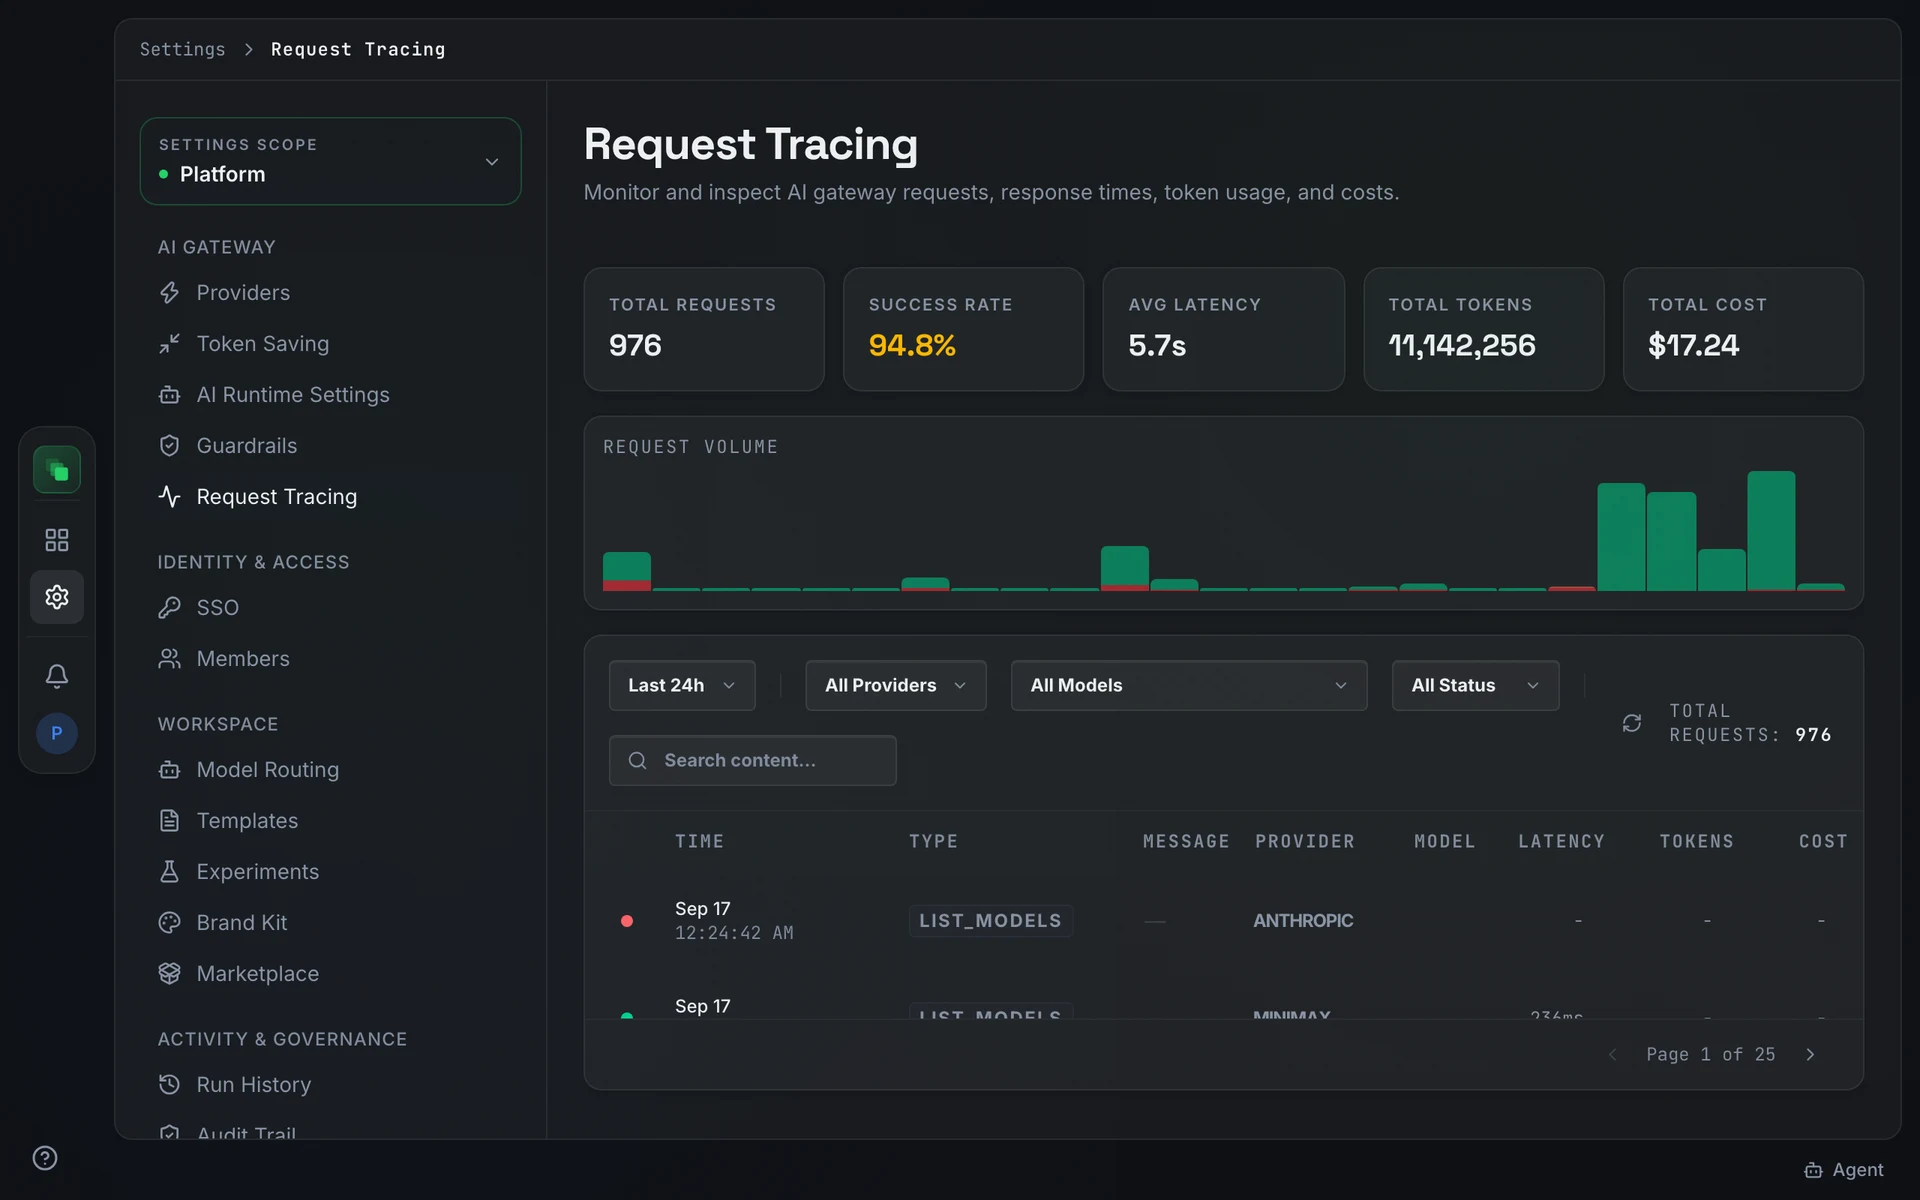
Read the stats and histogram
Open Settings → Request Tracing ("Monitor and inspect AI gateway requests, response times, token usage, and costs.").
Five stat cards span the top of the page:
A Request Volume histogram sits below the stat cards and plots request counts over time.
Filter requests
The filters row lets you narrow the request table by time range, All Providers, All Models, All Status, or free-text using Search content.... Combine filters to isolate a specific provider, model, or failed request type.
If the table stays empty after filtering, the page shows: "Ensure AI Gateway is running with log_store enabled."
Inspect a request
The request table columns are Time, Type, Message, Provider, Model, Latency, Tokens, and Cost. Select a row to open the detail sheet. The sheet shows the raw message payloads via ChatMessageView and any tool calls via ToolCallView.
Next steps
- Token Saving: reduce token consumption upstream of this log
- Guardrails: screen traffic before it appears in the log
- Run History: org-wide generation run history across all projects