
Usage
The Usage tab shows token consumption and platform activity for the selected period. At platform scope it aggregates every project; at project scope it covers the selected project only.
Open Settings → Usage (platform scope, #org-usage) or a project's Settings → Usage (project scope, #usage).
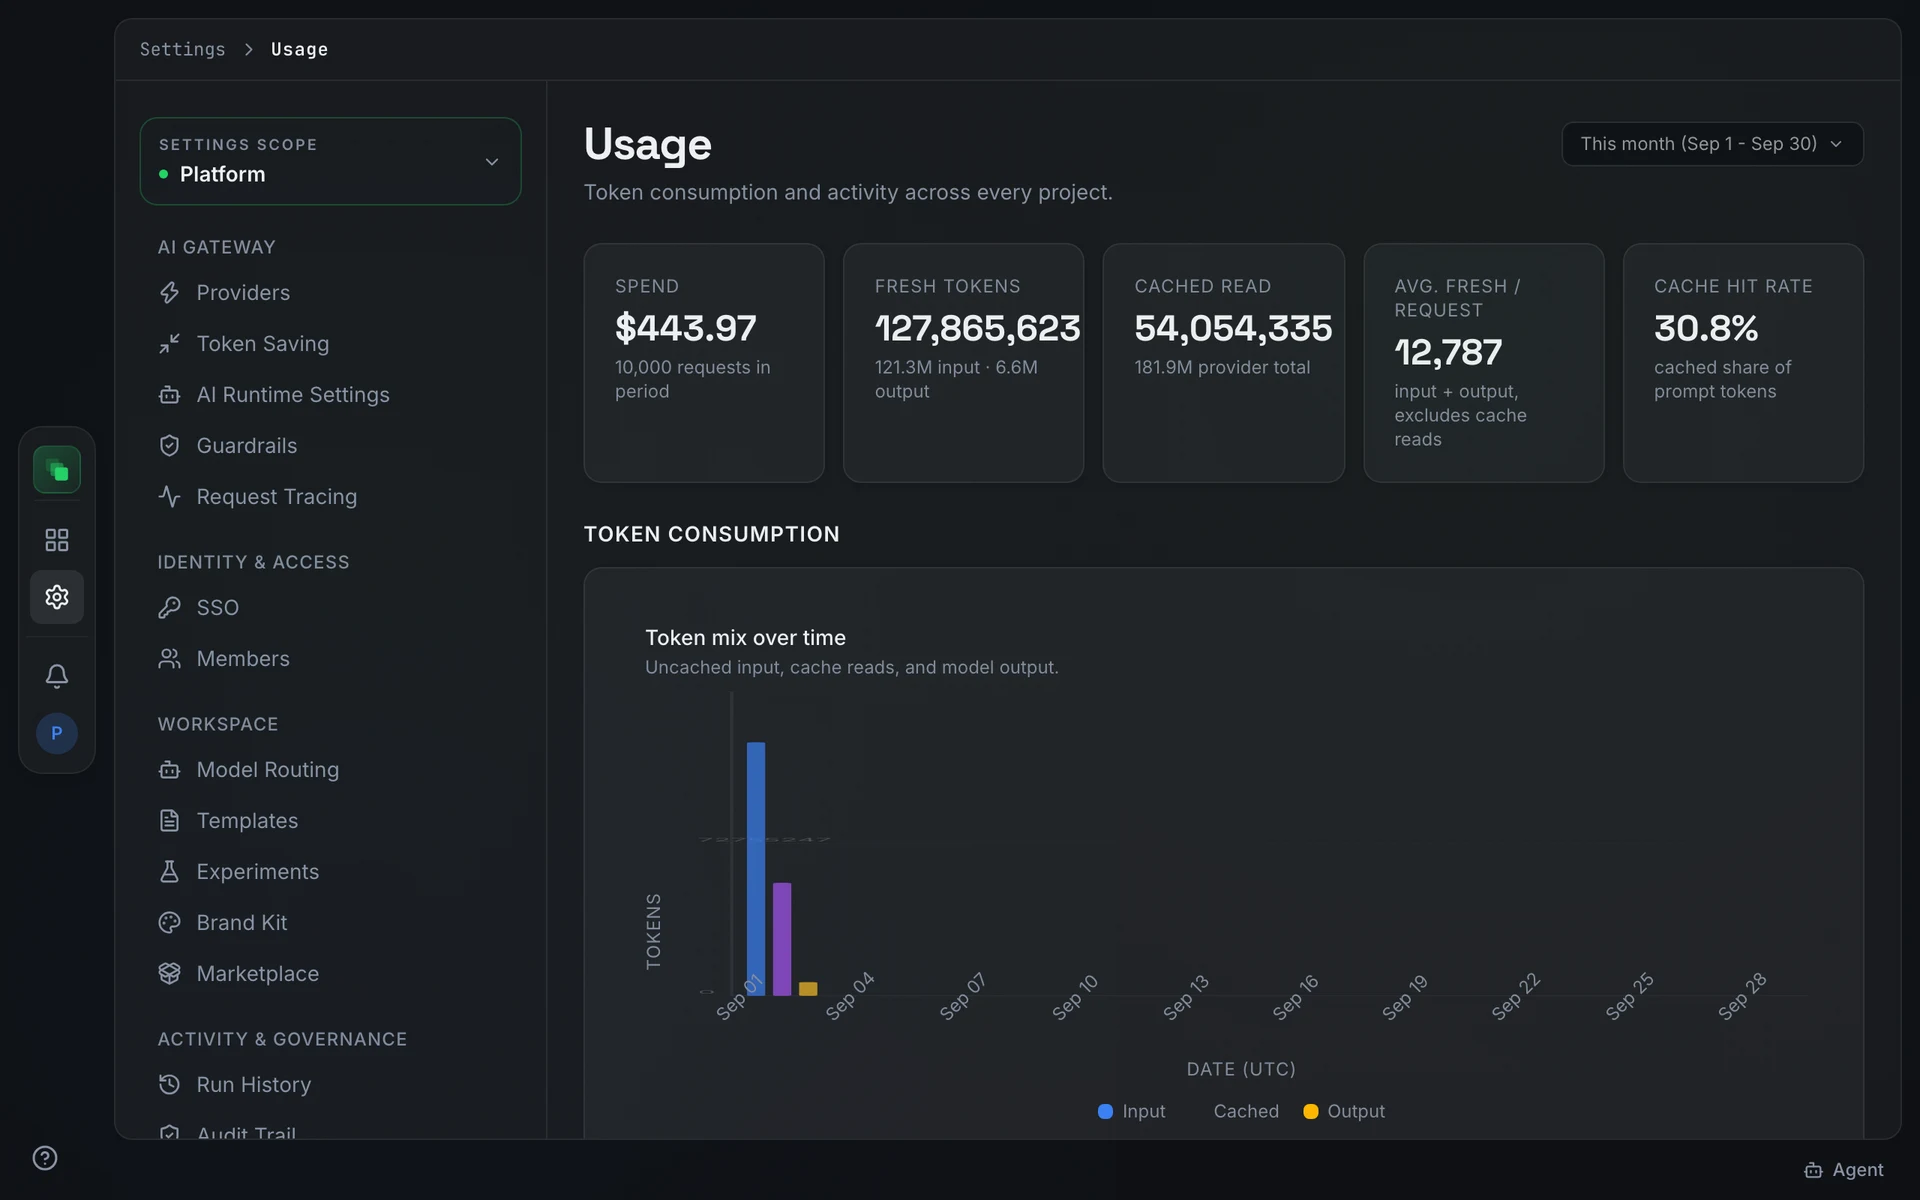
Metric cards
Five metric cards appear at the top of the tab.
Fresh tokens and Cached read together make up the total prompt token count; Cache hit rate shows how much of that prompt traffic was served from cache rather than re-sent to the model.
Token consumption
The Token consumption section has a Token mix over time chart labeled "Uncached input, cache reads, and model output." Three series are plotted so cache-heavy periods are visible alongside fresh traffic.
Below the chart, the Tokens per model table lists models with columns Model, Requests, Fresh input, Cached read, Output, Cost, and Provider total. Fresh input, cache reads, and output are kept separate so cache-heavy runs do not inflate the fresh prompt count.
Platform activity
The Platform activity section shows four metric cards.
Three bar charts below the cards plot artifacts, API calls, and knowledge queries over the selected period.
When something goes wrong
If the AI gateway is unreachable, an amber banner appears: "AI gateway is unreachable. Token totals are temporarily unavailable." The gateway-derived metric cards (Spend, Fresh tokens, Cached read, Avg. fresh / request, Cache hit rate) show dashes. Platform activity counts come from the application database and remain visible.
FAQ
What is the difference between Fresh tokens and Cached read?
Fresh tokens counts input and output tokens that the provider processed without a cache hit. Cached read counts input tokens that the provider served from its prompt cache at a reduced rate. The distinction matters for cost analysis: cached reads are billed differently from fresh input by most providers.
Where does the cost figure on Usage come from?
The Spend card on Usage uses the same gateway-priced cost as the Project spend card on Cost. It is a summary figure for context; the Cost tab has the full feature and model breakdown.
Next steps
- Cost: spend by feature and model.
- Productivity: delivery throughput and cycle times.
- Analytics overview: period picker and scopes.