
Cost
The Cost tab shows total AI spend for the selected period, attributed to features and models. At platform scope it covers every project in the organization; at project scope it covers the selected project only.
Open Settings → Cost (platform scope, #org-cost) or a project's Settings → Cost (project scope, #cost).
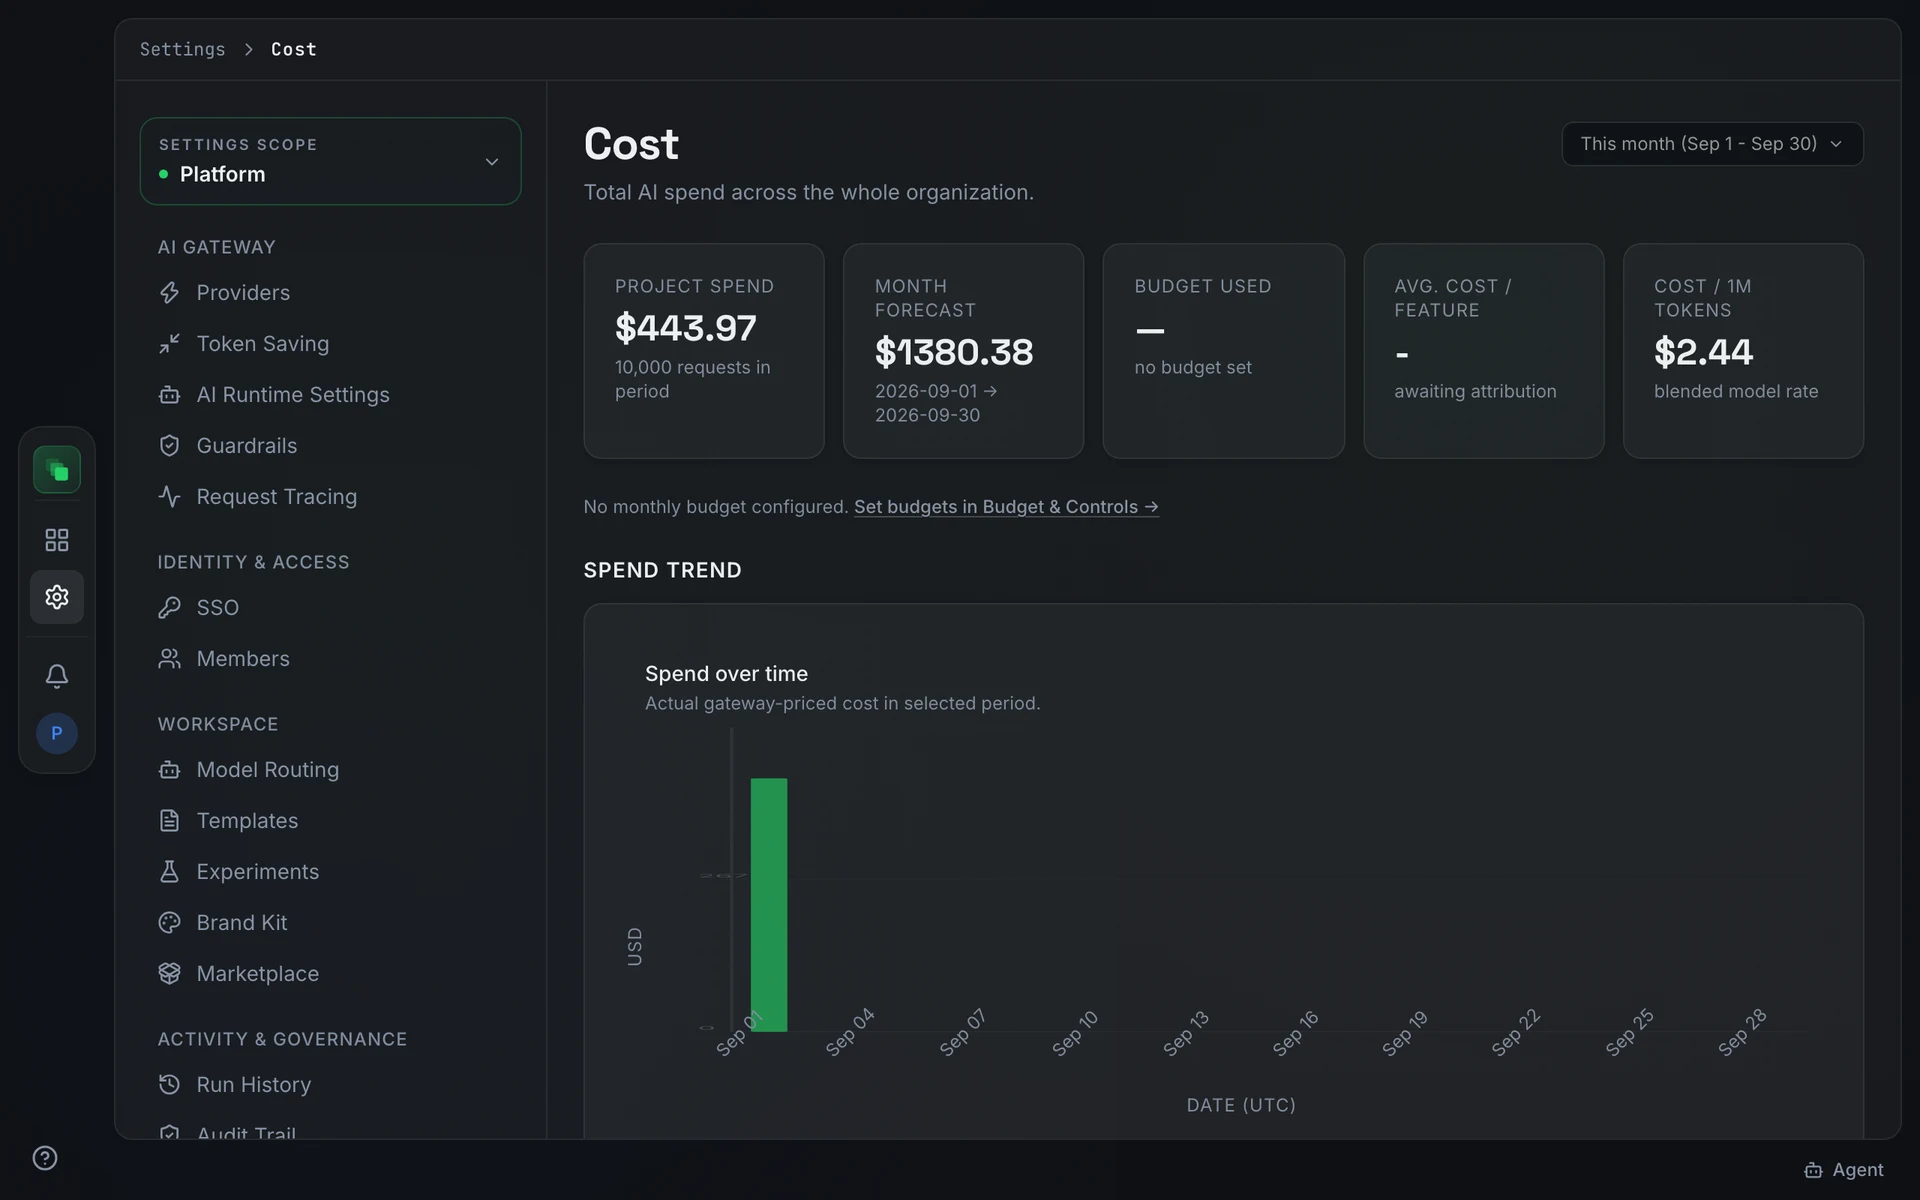
Metric cards
Five metric cards appear at the top of the tab.
Budget used shows "no budget set" when no monthly spend ceiling is configured. Budget configuration is per-project; open a project's Settings → Budget & Controls to set a monthly spend ceiling. The platform scope tab has no configurable budget.
Spend trend
The Spend trend section contains a Spend over time chart labeled "Actual gateway-priced cost in selected period." The x-axis spans the selected period; the y-axis shows cost in USD.
Where spend goes
Where spend goes has two tables.
Cost per feature lists the top 10 features by spend, with columns Feature, State, Requests, Tokens, and Cost. An "Unallocated project activity" row appears when gateway requests cannot be tied to a specific feature. Attribution coverage percentage is shown below both tables.
Cost per model lists the top 10 models by spend, with columns Model, Requests, Avg. / request, % of spend, and Cost. Token-level detail for each model is on the Usage tab.
When something goes wrong
If the AI gateway is unreachable, an amber banner appears: "AI gateway is unreachable. Spend totals are temporarily unavailable." Metric cards that derive from gateway data show dashes until the gateway reconnects.
FAQ
Why does Avg. cost / feature show a dash?
Attribution requires at least one gateway request linked to a feature in the selected period. The card shows a dash until requests are attributed. The sub-label on the card changes from "awaiting attribution" to the count of attributed features once data is available.
Where do I set a spending limit?
Budget configuration is per-project. Open the project's Settings → Budget & Controls to set a monthly spend ceiling and alert thresholds. There is no organization-level budget.
Next steps
- Usage: token consumption and cache efficiency.
- Productivity: delivery throughput and cycle times.
- Analytics overview: how the period picker and scopes work.