
Productivity
The Productivity tab shows delivery throughput, cycle time, and flow health for the selected period. At platform scope it covers every project in the organization; at project scope it covers the selected project only.
Open Settings → Productivity (platform scope, #org-productivity) or a project's Settings → Productivity (project scope, #productivity).
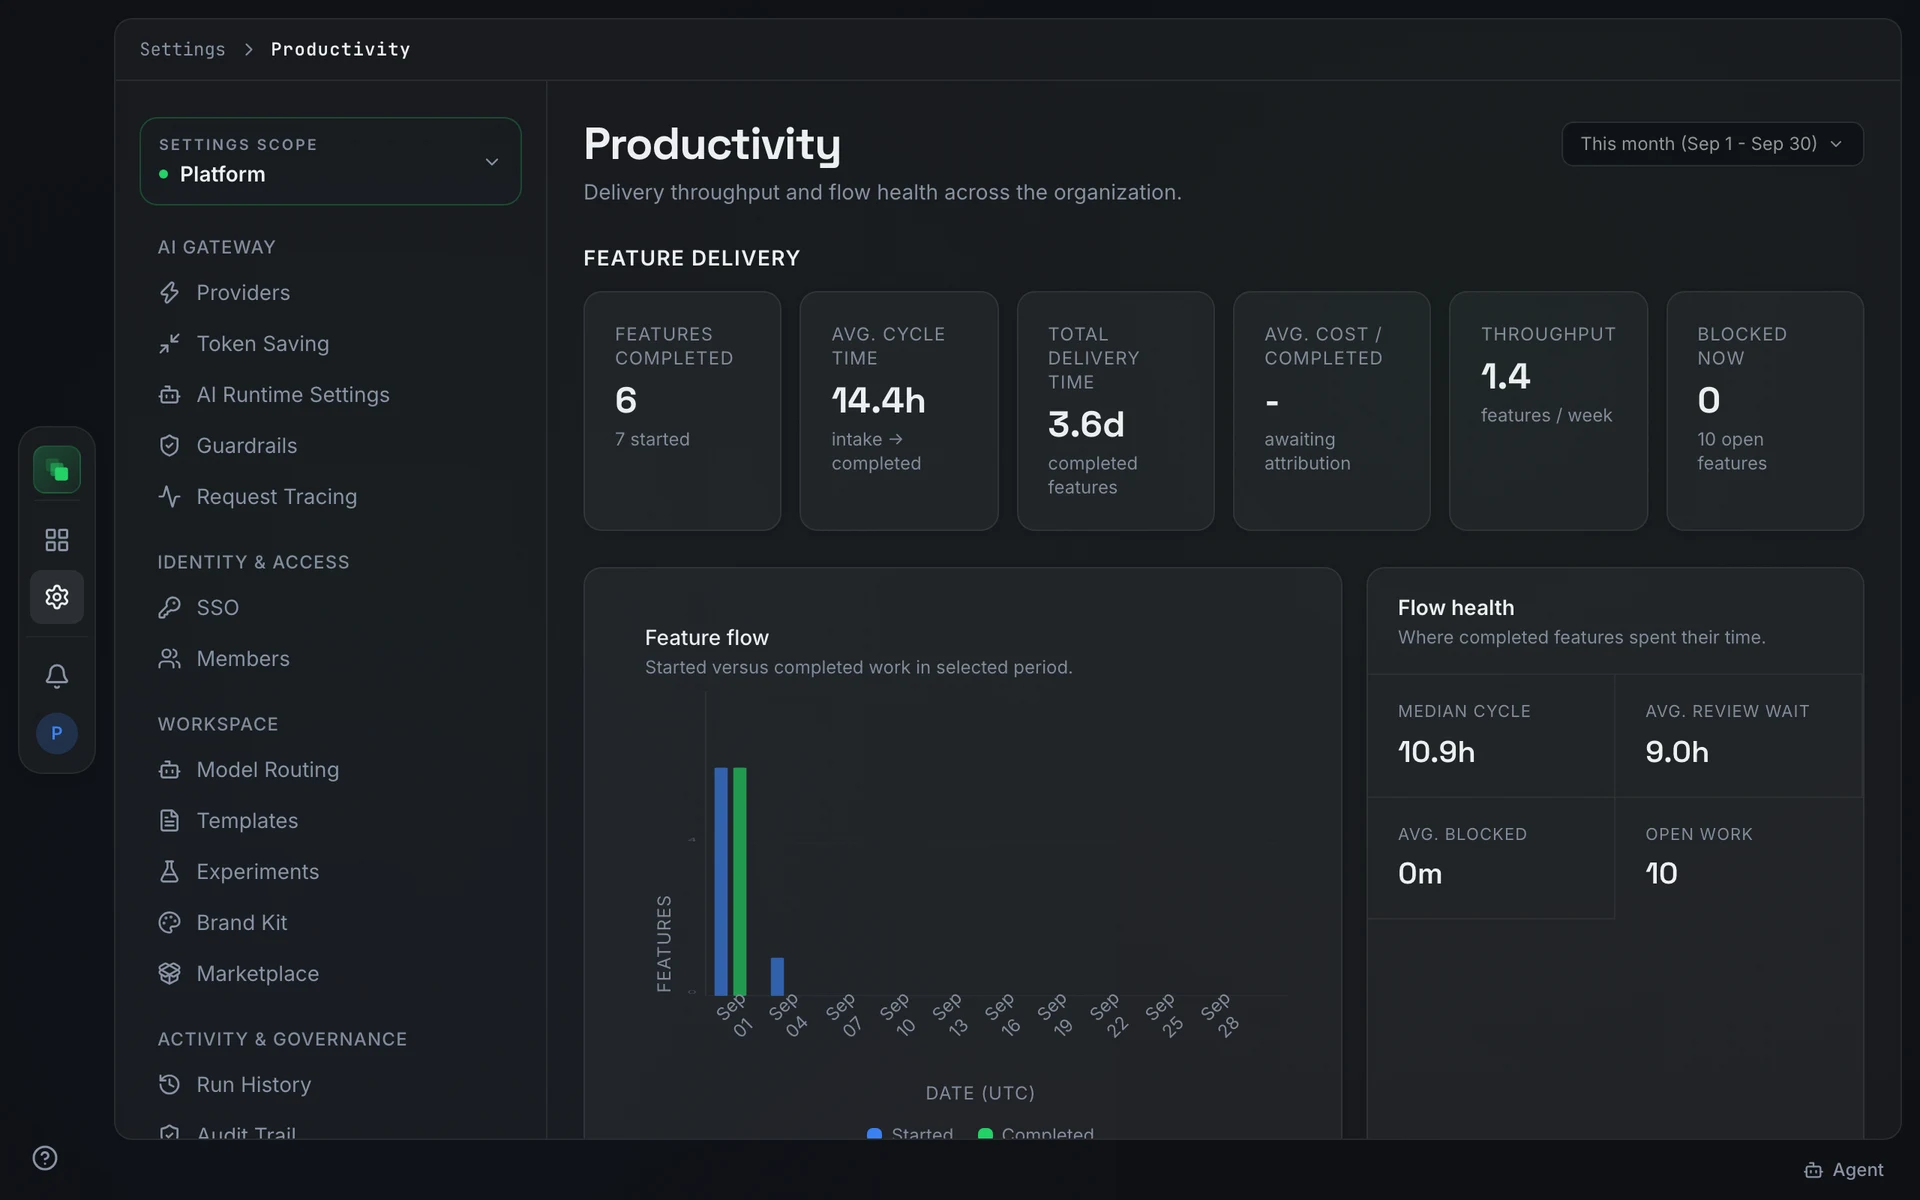
Feature delivery
The Feature delivery section has six metric cards.
Avg. cost / completed shows "awaiting attribution" when completed features have no linked gateway spend in the period.
Feature flow and flow health
The Feature flow chart plots started and completed work over the selected period ("Started versus completed work in selected period.").
The Flow health grid sits alongside the chart and shows four values for completed features in the period.
Completed feature detail
The Completed feature detail table lists up to 20 completed features in the period, with columns Feature, Completed, Cycle time, Review, Blocked, and AI cost. The AI cost column is populated from the same gateway attribution data as the Cost tab; it shows a dash when no spend is attributed.
Quality and automation
The Quality & automation section has five metric cards covering process quality in the period.
FAQ
Why does Avg. cost / completed show "awaiting attribution"?
Cost attribution links gateway requests to features through the work item relationship. If completed features in the selected period have no gateway requests attributed to them, the card shows "awaiting attribution" until attribution data is available.
What counts as a feature for Throughput?
Throughput counts work items that reached completed state, divided by the number of weeks in the selected period. It covers the same set as Features completed; the card expresses the rate per week rather than the raw count.
Next steps
- Cost: spend by feature and model.
- Usage: token consumption and cache efficiency.
- Analytics overview: period picker and scopes.